Find a local pick your own farm here!

Home Canning: Statistics and Demographics about Home Canning and Preserving

Statistics and Demographics about Home Canning and Preserving

Whether you are a journalist writing an article, a student doing research or just curious, the following research about who cans (preserves, bottles, freezes, etc.) foods at home may interest you. The results come from several surveys and were compiled by the USDA.

These surveys were performed between October 2000 and January 2001 using random telephone surveys.

Aside from the interesting aspects of who cans what, these studies show changes in the amount and types of foods canned at home, as well as methods used and of concern, the continued use of high-risk practices, including some that could lead to botulism. Unfortunately, untrained friends or relatives are the primary source of instructions for many of today's home canners (43.5% in the national survey, 55.1% in the Georgia survey), rather than tested recipes from universities, the USDA and the manufacturers of home canning equipment (note: all of the recipes for home canning presented on pickyourown.org come from these sources, unless specifically noted otherwise.

I can also provide photos of farm activities, fruits, vegetables, corn mazes, etc. If you have additional questions or prefer a verbal discussion, or need an appearance on a radio or tv program, feel free to use the feedback form to contact me.

I hope the information below is helpful!


Table 1. Demographic Characteristics of Home Canners

Characteristic USDA Categories USDA Sample NCHFP & GaPOLL Categories NCHFP Sample GaPOLL Sample
Age Under 25 10 18-24 7 13
25-34 21 25-34 17 18
35-49 28 35-49 30 33
50-64 24 50-64 20 26
65 and over 15 65 and over 21 9
 
Education Grade school or less 17 Less than high school 16 7
High school or less 18 High School (GED) 28 26
High school graduate 36 Less than 4yr. degree 25 33
Vocational training 5 Bachelor degree 21 20
College or more 22 Post Graduate 7 15
 
Income Under $5,000 14 <$14,999 4 5
$5,000-$12,499 30 $15,000-$24,999 6 6
$12,500-$19,999 27 $25,000-$34,999 7 9
$20,000 and over 11 $35,000-$49,999 16 13
Other* 16 $50,000-$74,999 14 12
    $75,000 or more 13 27
    Other* 41 29
 
Total Sample Size   901 135 179
* Other responses include Don't Know/Refused/Not Answered.
  • Approximately 50-58.5% of home canners were 35-64 years of age in each survey. 28-33% were 35-49, while another 20-25.5% were 50-64 years old.
  • In the USDA national sample, 39% were 50 years and older and 31% were under age 35. In the NCHFP national sample, there was a higher percentage (41.2) aged 50 years and older and a smaller percentage (24.4) under age 35. The GaPOLL sample had more canners in the younger age categories (under age 65) than the NCHFP sample.
  • The numbers of home canners with at least a high school education were higher in the NCHFP (81.5%) and GaPOLL (93.1%) than in the 1975 USDA study (63%). In addition, the number of home canners with formal education beyond high school was also much higher in the more recent surveys (53.3% NCHFP and 67.3% GaPOLL versus 27% USDA).
  • The high levels of missing information on income in the NCHFP (40.7%) and GaPOLL (29.1%) surveys make it difficult to describe the true income distribution of those participating in home canning. Of those choosing to report their income, 16.3% and 19.3% (NCHFP and GaPOLL respectively) have household incomes of less than $35,000/year; 43% and 51.6% (NCHFP and GaPOLL respectively) have incomes of more than $35,000.


Table 2. Percentage of Households Canning Varous Products

  SURVEY
PRODUCT USDA NCHFP GaPOLL
Tomatoes 73.0 60.0 34.3
Fruits 56.0 47.4 31.5
Vegetables 51.0/18.0* 71.1 47.8
Jams/Jellies 41.0/41.0 Not asked 26.4
Pickles 48.0 Not asked 12.4
* Percent canning low acid vegetables/vegetable mixtures (separate questions in the USDA survey).


  • In 1975, tomatoes were being canned by 73% of the households surveyed. Today the percentage canning tomatoes has decreased (60% and 34.3% NCHFP and GaPOLL respectively) and vegetables (71.1% and 47.8% NCHFP and GaPOLL respectively) are now the most frequently canned product.
  • The increase in the percentage of households canning vegetables focuses concern on the use of improper methods for canning vegetables, which require a pressure processing method.
  • The percentage of households canning fruits has decreased slightly from 1975.


Table 3. Percentage of Home Canners Using Various Sources for Instructions.

  SURVEY
SOURCE USDA NCHFP GaPOLL
USDA Publications 9.0 3.2 1.9
Extension Publications 11.0 0.8 3.1
Cookbook 42.6 16.8 15.8
Magazines or Newspapers 12.2 0.8 3.8
Friends or Relatives 60.4 43.5 55.1
Manufacturers* 9.8 11.5 7.6
Other No Data 21.5 15.8
* Manufacturer's cookbook.


  • As in 1975, the most often cited source of instructions in the NCHFP and GaPOLL surveys is friends or relatives (43.5% and 55.1% respectively).
  • The percentage of home canners using the recommended USDA and Extension Service Publications in 1975 was very small but today that percentage has decreased even more.
  • In 1975, 42.6% of home canners were using cookbooks as their source of instruction, but today that number has decreased (16.8% and 15.8% NCHFP and GaPOLL respectively).


Table 4. Percentages Using Various Methods for Canning Acid and Low Acid Foods.

  Survey
  USDA NCHFP GaPOLL
METHODS Fruits & Tomatoes* Vegetables** Fruits & Tomatoes Vegetables Fruits & Tomatoes Vegetables
Boiling Water 52.8/51.5 39.2/27.9 55.0 34.4 56.4 46.3
Pressure Cooker 4.0/3.9 10.0/5.1 16.0 16.1 29.0 24.5
Pressure Canner 14.9/20.8 46.6/38.0 11.0 28.1 22.5 8.3
Oven Less than 1% Less than 1% 2.0 3.3 8.8 7.4
Open Kettle 43.6/35.1 13.5/24.8 14.0 13.0 21.7 15.8
Other Responses*** No Data No Data 2.0 4.4 12.8 19.4

* Percent canning fruits/tomatoes (separate questions in the USDA survey).
** Percent canning low-acid vegetables/vegetable mixtures (separate questions in the USDA survey).
*** Other Responses includes Don't Know, Refused/Not Answered.
  • The usual USDA recommended processing method for canning fruits and tomatoes is boiling water canning, so one would expect a majority of home canners to be using this method. Recommended pressure processes are available as alternatives to the boiling water canner. Oven and open kettle canning have not been recommended by USDA as methods for fruits and tomatoes since 1943. Table 5 contains the methods that home canners report using for the acid-food categories of fruits and tomatoes.

    • The percentage of home canners using boiling water canning for fruits and tomatoes has not increased much since 1975. However, the percentage using the open kettle method (no processing of the filled jar) has decreased from 43.6/35.1 (fruits/tomatoes) to 14-22 (NCHFP-GaPOLL).
       
    • More people are using a pressure cooker for processing fruits and tomatoes now than in 1975. A smaller percentage of the NCHFP respondents reported using a Pressure Canner than in either USDA's 1975 survey or the GaPOLL.
       
    • The NCHFP and GaPOLL surveys both indicated similar percentages using the boiling water canner for processing fruits and tomatoes. The percentages using all other methods were not consistent in these two surveys.
       
  • Recommended USDA processing procedures for home canning of vegetables other than tomatoes have only included pressure processes since 1943. Furthermore, boiling water, oven and open kettle canning have been described as unsafe for low-acid foods since that time. Beginning in 1957, USDA Home and Garden Bulletins included a statement to add 20 minutes to processing times used for pressure canners when using a pressure cooker. Therefore, in 1975, USDA did recommend a method for processing vegetables in a pressure cooker (saucepan). However, this endorsement was removed from their recommendations in 1988 with the publishing of the Complete Guide to Home Canning. This latter bulletin stated that recommended small pressure canners hold four quart-size jars; pressure saucepans with smaller volume capacities are not recommended for use in canning. The methods home canners report using for low-acid vegetables are shown in Table 5.

    1. In 1975, slightly more than half of home canners were using either a Pressure Canner or cooker for vegetables (56.6 combined), as recommended. A smaller percentage (43.1 combined) reported using either of these methods for vegetable mixtures. Less than half of home canners in the NCHFP (44.2 %) and GaPOLL (32.8 %) surveys reported using either pressure-based method.
    2. The number of home canners using no processing (the open kettle method) for vegetables was high enough to cause concern in 1975. Unfortunately, today there appears to be little decrease in the percentage of home canners who choose to follow this very risky practice.
    3. The percentages of home canners today (3.3 and 7.4, NCHFP and GaPOLL respectively) also reporting the use of oven canning methods are of concern.


Table 5. Percentages of Home Canners Using Various Methods.

  SURVEY*
Methods USDA** GaPOLL
Boiling Water Canner 12.6/9.5% 48.8%
Pressure*** 3.9/5.1 7.0
Oven Less than 1% 9.3
Open Kettle 85.1/87.0 34.9
Other Responses**** No data 9.3
* No data available from NCHFP Survey.
** Percent Canning Jams/jellies (separate questions in the USDA survey).
*** Includes responses of pressure canner and pressure cooker, combined.
**** Other Responses includes Don't Know, Refused/Not Answered.
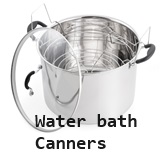
 

  • Prior to 1978, paraffin was recommended in USDA publications for sealing jellies and jams. Then in a 1978 USDA bulletin, a 5-minute boiling water process was recommended for sealed jars of jellies, jams, conserves, marmalades, and preserves for those residing in warm or humid climates; the use of paraffin was restricted as an option for jelly only. USDA has recommended only a boiling water process for all jams and jellies since 1988.
  • The GaPOLL results indicate that the number of home canners using a boiling water process for jellies and jams has increased since 1975. However, less than half of home canners today (48.8 percent) are following this practice, while 35% report using open kettle methods, 9% oven canning and 7% pressure canning. In 1975, 85/87% (for jams/jellies) used the open kettle method, while 12.6/9.5 and 3.9/5.1 used boiling water and pressure methods, respectively.


Conclusions


  • Current surveys reveal that greater adoption of science-based home canning techniques is needed, a finding similar to the 1975 national USDA survey.
  • One finding of greatest concern is the lack of pressure-based processing methods for vegetables. A large percentage of home canners are at high risk for foodborne illness, including botulism.
  • Findings document risky practices and knowledge that should be targeted in educational programs and publications.
  • Ongoing analyses indicate interactive effects for age and education with choices of processing methods and sources of instruction.
     

References and Methods

Two telephone surveys were conducted in 2000-2001 by the National Center for Home Food Preservation (NCHFP) at the University of Georgia (UGA) in conjunction with the Survey Research Center (SRC), UGA. Structuring and supervision in an interviewer's work is essential in order to gather data in a controlled and standardized fashion (4). Thus, interviewers trained in survey research and telephone-interviewing technology by the SRC were used for the interviewing in both surveys. Appropriate supervision during interviews provided quality control. Probability analyses estimated that the number of interviews conducted were more than sufficient to achieve the target levels of precision and accuracy in drawing conclusions on population responses based on sample estimates (1).

Between October 2000 and January 2001, 135 telephone interviews from households randomly selected throughout the U.S. were completed as part of a national survey. A 42-item survey instrument that included 16 open-ended questions was developed by the NCHFP and refined with the assistance of the SRC. 1244 eligible respondents were contacted; these yielded the 501 complete interviews of people canning and/or freezing food at home, for a cooperation rate of 40.3%. Of the 501 in the study, 135 (27%) canned food at home during 1999.

Then in November 2001, 179 Georgians answered a series of 10 home canning questions in another state telephone survey, the Georgia Poll. The Georgia Poll is conducted routinely in a random sampling of adult residents for the purpose of learning the attitudes and opinions of respondents towards several key sets of questions, as well as information about local and national affairs. The home canning interviews were a subset of 427 completed telephone interviews in the Georgia Poll. The cooperation rate for the overall study was 40.5%.

Data from these two UGA surveys were compared to the results of a 1976 national survey conducted by USDA (2). The methodologies for each of these studies are summarized in Table 1.

Table 6. Comparison of Canning Surveys
Study Brief Study Description Study Dates Code*
Davis and Page, 1979
  • National study of home canners; surveyed canning practices used in 1975.
     
  • 979 questionnaires were obtained from 1,031 home canners identified in an initial screening to locate home canners. The initial sampling resulted from a statistically valid sample drawn to represent all private households in the conterminous U.S. consistent with census data. 901 completed questionnaires were used in analyses.
1976 USDA
Andress, et al., unpublished
  • National Center for Home Food Preservation survey of individuals primarily responsible for household food preparation to determine activity level of home canning and freezing and use of critical safety practices.
     
  • Interviews completed by the Survey Research Center at the University of Georgia between October 24, 2000 and January 10, 2001.
     
  • Eligibility of respondents was determined by asking, if in 1999, anyone in the household either canned foods or froze foods other than foods that were purchased in the supermarket. Sample of home canners consisted of 135 interviews.
2000-2001 NCHFP
Andress, et al., unpublished
  • National Center for Home Food Preservation placed 10 home canning questions in a statewide telephone survey (the Georgia Poll, a survey about local and national affairs).
     
  • Interviews were completed by the Survey Research Center at the University of Georgia in November 2001. Respondents were a random representative sample of the adult population.
     
  • In Fall 2001, respondents were asked about their canning practices during the past year.
2001 GaPOLL
* This acronym will be used throughout this paper to represent the study under consideration.

Source page: http://www.uga.edu/nchfp/papers/2002/sneposter.html